I put a calendar of squares on the home screen, in three sizes
The most useful thing a fitness app can show you on a quiet Tuesday isn’t a number. It’s a pattern. Did the last three weeks look like the three before them? Is there a hole where a holiday went? Did you actually log food on the days you think you did?
A row of totals can’t answer that. A calendar of squares can, at a glance, and everyone already knows how to read one because of GitHub’s contribution graph. So Home can now show one, for your workouts, for your food logging, or both.
It’s off by default. Home is still the same screen you had yesterday until you turn it on. (And if you’d rather not open the app at all, there’s now a widget for your phone’s home screen.) (The screenshots below use Musclog’s demo data, so the patterns are made up. Yours will be yours.)
What a square means
Each square is one calendar day, and darker means busier.
- Workouts: the number of workouts you completed that day. A workout belongs to the day it started, so a late session that runs past midnight doesn’t split in two. One workout is already a solid shade, and two reach the darkest.
- Nutrition: the number of different meals you logged that day, out of breakfast, lunch, dinner and snacks. All four reaches the darkest square.
That nutrition rule is deliberate. When the AI estimates a meal, it can expand “chicken salad” into twelve ingredient rows. If the square counted rows, one lunch would look like twelve lunches and a lazy-logging day would outshine a careful one. Counting distinct meals means a day is measured by how much of it you accounted for, not by how finely you wrote it down.
Two more rules keep it honest:
- A quiet day never reads as an empty one. Any activity at all is at least the lightest shade, however high the top of the scale is.
- The scale is fixed. It isn’t stretched to fit your busiest day, so a shade means the same thing in every window and in every month. A square that was dark in September is the same dark today.
export function activityLevel(value: number, max: number): ActivityHeatmapLevel {
  const safeValue = sanitizeValue(value);
  if (safeValue === 0 || !Number.isFinite(max) || max <= 0) {
    return 0;
  }

  const level = Math.ceil((safeValue / max) * ACTIVITY_HEATMAP_LEVELS);

  return Math.min(ACTIVITY_HEATMAP_LEVELS, Math.max(1, level)) as ActivityHeatmapLevel;
}
Tap a square, or hover over it on the web version, and the day is read out: “Oct 14: No workout”, “Sun, Aug 16, 2026: Nothing logged”. Every square also has a screen-reader label with the same text.
Three ways to show it
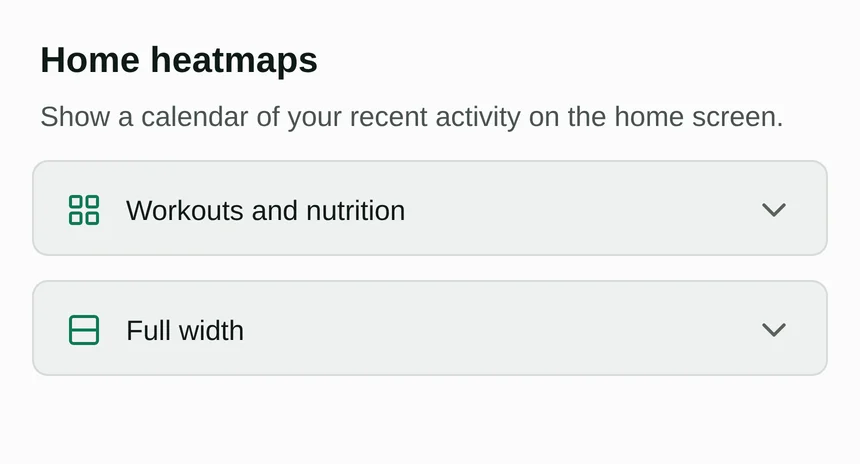
You choose which heatmaps appear (workouts, nutrition, both) and, when it makes sense, how they’re laid out.
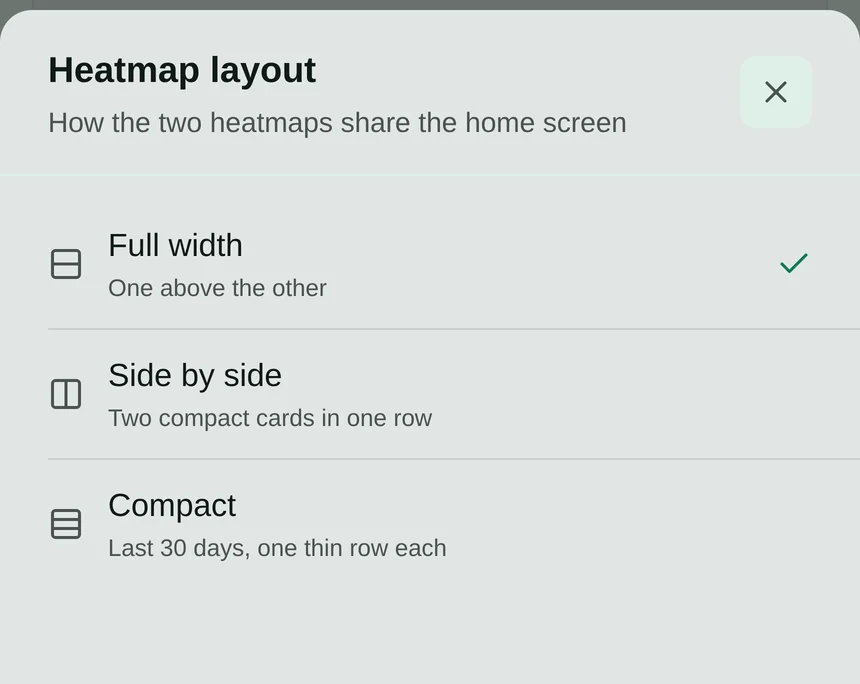
Full width
The classic. One card per heatmap, stacked, each showing the last 18 weeks as one column per week and one row per weekday, with month names on top and a “less to more” legend underneath.
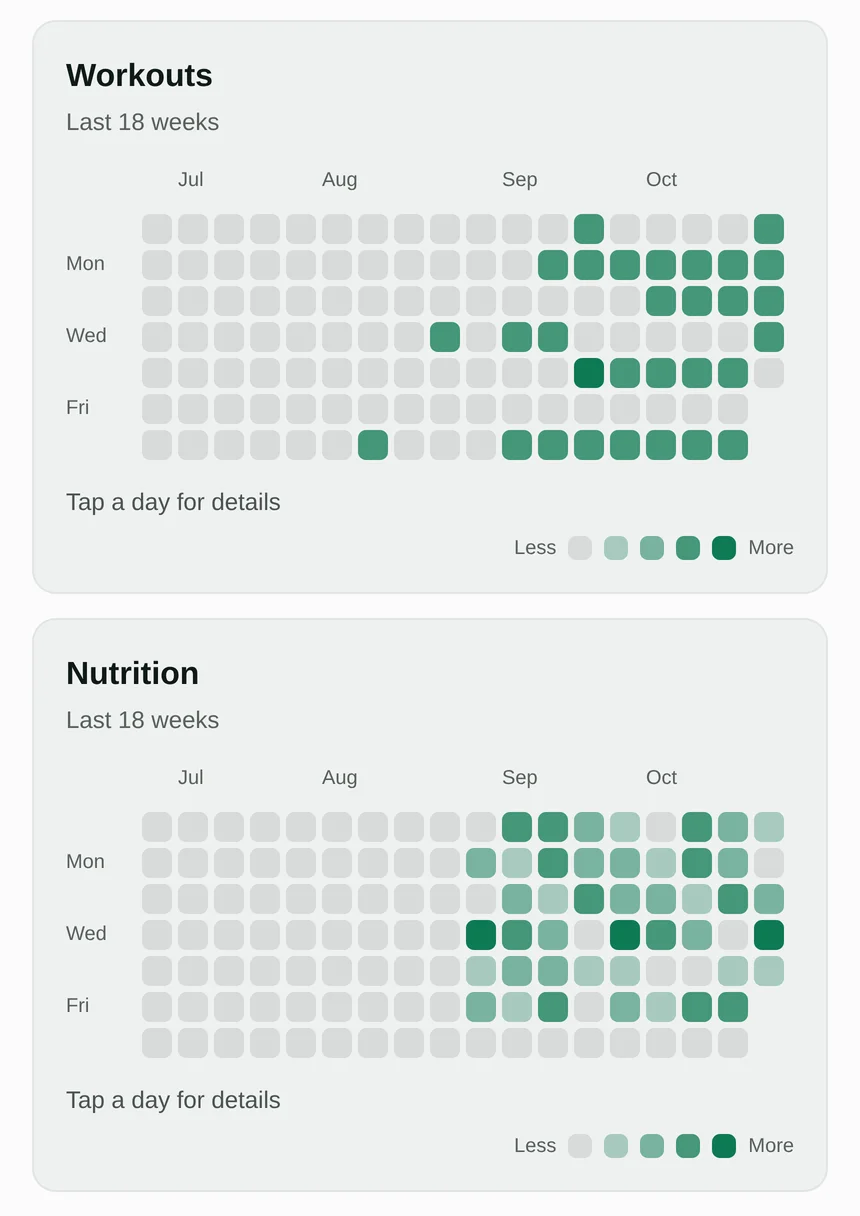
It fits a phone without scrolling. If a window is ever wider than its card (say, on a very small screen), the hidden side fades into the card and an arrow appears that scrolls it into view. On the web, where a mouse has no horizontal scroll wheel, that arrow is the only way to reach the hidden weeks, which is why it exists at all.
Side by side
Both heatmaps in one row, as two small cards with the last 30 days each. No month names, no legend, no hint text. Just a title and a month of squares.
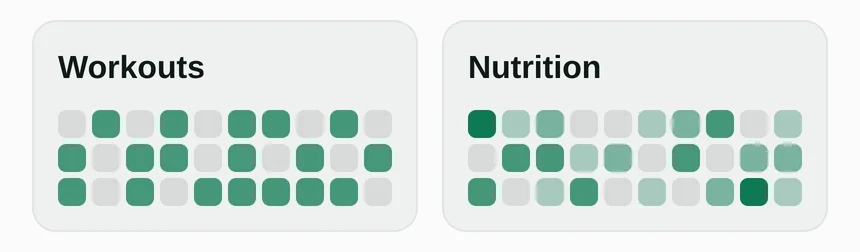
Tapping a square swaps the card’s title for that day’s readout, so the card never changes height and nothing below it jumps:
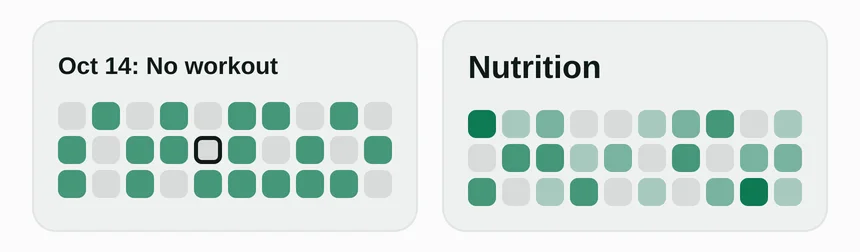
This layout only applies when both heatmaps are on. A single heatmap always gets the full width, because half a row with nothing next to it is just wasted space.
Compact
The shortest option, for one heatmap or both: a single thin card with a row of the last 30 days per source. A small dumbbell icon marks workouts and a fork-and-knife marks food, so there’s no legend and no labels.
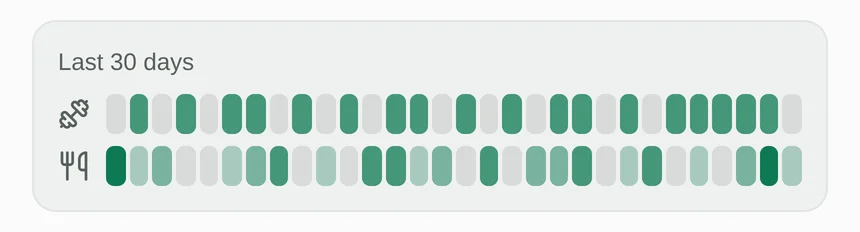
It uses a fraction of the height of the full version, which matters on a Home screen that already has a summary card, your quick actions and a weekly review on it.
The side-by-side version got redesigned
I want to be upfront about this one, because the first version of it was bad.
My first attempt at “side by side” was the full calendar, just shrunk: 12 weeks, smaller squares, no weekday column. It technically fit. It also looked terrible. A calendar grid is seven rows tall whatever its width, so each card was nearly as tall as before and left half its width empty. I had made it narrower and not any shorter, which defeated the point.
The fix was to stop pretending it was a calendar. A half-width card has width to spare and no height, so it needs the opposite shape: the last 30 days as one run of squares, oldest first, wrapped into three rows of ten. You lose the weekday alignment, which you can’t read at that size anyway, and each card drops to roughly half its previous height.
If ten per row doesn’t suit you, that’s a single constant in the code. Fifteen would give two rows of slightly smaller squares. I’d rather ship one good default than a slider.
The compact one is also a widget
The compact layout turned out to be the right shape for something else: the home screen of your phone. So there’s now an Activity Heatmap widget for Android and iOS that is that same card: two thin rows of the last 30 days, workouts on top and food logging underneath, with no need to open Musclog to see whether the month looks the way you think it does.
It is its own thing, not a mirror of the Home setting. You can leave Home heatmaps off and still put the widget on your home screen, and it always shows both rows, because there’s no settings screen on a widget to choose between them. It’s a 4×2 widget on Android and a medium widget on iOS.
Everything about what a square means carries over, because it’s the same code and not a copy of it. The widget uses the same level calculation, the same fixed scales (one workout is the third of four steps, all four meals is the darkest) and the same table of opacities as the Home card, so a day is the same shade in both places. That table used to live inside a chart component; it moved into the plain utility file so the widget could import it without pulling in a UI component.
export const ACTIVITY_LEVEL_OPACITY: Record<ActivityHeatmapLevel, number> = {
  0: 1,
  1: 0.32,
  2: 0.52,
  3: 0.76,
  4: 1,
};
A few things are different, because a widget isn’t a screen:
- It can’t draw with opacity, so the colors are mixed in advance. Neither widget runtime has an opacity modifier. The snapshot the app hands the widget carries a level from 0 to 4 for each day, plus five ready-made colors: the theme’s accent at each of those opacities, written as
#rrggbbaa. The widget only picks one per square. - Midnight doesn’t blank it. The Nutrition widget has to fall back to “Open Musclog to refresh” after midnight, because yesterday’s calorie total is no longer true. A heatmap doesn’t have that problem. On iOS I schedule a second entry for midnight in which every row moves one day along and the new day is empty, which is exactly right at 00:00, so the widget stays readable until the app refreshes it.
- It updates when the data does. Finish a workout or log a meal and the right square darkens, because the widget refreshes on any change to those two tables, as well as when the app comes to the foreground or the day changes. As with the Home card it reads only plain columns (when a workout started, and the date, time zone and meal type of a food log), so nothing is decrypted to draw it.
- Tapping it opens Home, where the heatmaps are if you’ve turned them on.
It also follows the Nutrition widget rather than the Cycle widget on one point: it doesn’t hide behind the app locks. It only shows which days had something in them, never a figure from your encrypted records, so there’s nothing in it that a lock exists to protect. The Cycle widget is stricter because a day count is exactly the kind of thing you may not want visible on a locked phone.
Thirty squares without weights
The iOS version is the easy one: thirty small rounded rectangles in a row, each told to share the width equally, like the Home card.
Android was the awkward one. Its widget runtime has no flex weights and no gap between children, and the underlying Glance layouts accept at most ten children in a row. So each square is a fixed-size box (5dp wide) followed by a 2dp spacer, and each row is six groups of five, never thirty loose children:
<Row verticalAlignment="center">
  {groups.map((group, groupIndex) => (
    <Row key={`${rowKey}-${groupIndex}`} verticalAlignment="center">
      {group.flatMap((level, index) => [
        <Box modifiers={[size(5, 14), background(props.levelColors[level]), cornerRadius(2)]} />,
        <Spacer modifiers={[width(2)]} />,
      ])}
    </Row>
  ))}
</Row>
Thirty squares at 7dp each (5dp plus the 2dp gap) is 210dp, which is why the widget is four cells wide: the narrowest a 4-cell widget can get is about 250dp, minus a little padding on each side. A test fails the build if that arithmetic stops working, or if any row grows past ten children.
What it costs
A heatmap sounds like a decorative feature, but it’s two live database queries per chart, so I was careful about when they run.
- With the setting off, it costs nothing. The Home screen mounts one component that checks the setting first and renders nothing, and the queries live below that check. A test fails the build if the Home route ever reads a heatmap setting or subscribes to the data itself.
- Nothing is decrypted. Musclog encrypts your food names and nutrient values, and decryption is the expensive part of reading a long diary. The heatmap only reads plain columns: when a workout started, and the date, time zone and meal type of a food log. Those are exactly the fields it needs and nothing more.
- It updates live. Log a meal and the square darkens. The meal type is edited in place on a row that already exists, so the query watches that column explicitly, or an edit would never show up.
- Days are calendar strings, not timestamps. Each day is a local
yyyy-MM-ddkey. A timestamp for “midnight” drifts by an hour across a daylight-saving change and quietly lands a day on the wrong square.
Turning it on
Open Settings → Appearance and home → Home heatmaps. Pick workouts, nutrition or both, and if you picked both, pick a layout. The first time you update to this version, the What’s new tour also tells you about it.
For the widget, long-press your home screen, choose widgets, and look for Activity Heatmap under Musclog.
What it deliberately doesn’t do
It doesn’t count streaks, and it doesn’t turn a gap into a red mark. A pale square isn’t a failure. It’s a rest day, a holiday, a busy week or a day you didn’t feel like logging, and the heatmap treats all of them the same: as information about a pattern, never a verdict about you.
